Visualizing the data of our world
We’ve always been fond of maps. In our early years (1996/1997), we did a project called ‘Transparent Amsterdam’, that aimed to give citizens access to the Internet at public terminals. A digital map was created to show all building plans in the city. This was still done by hand from paper maps at the ARCAM institute that were digitized. Two computers of The Digital City were processing the updates once a week. Viewing the map required a broadband connection and the latest technology, therefore a ‘light’ version was created that was in use until 2001.
Another highlight in the use of maps formed our project Amsterdam Realtime in 2002 with artists Esther Polak and Jeroen Kee, with a corresponding exhibition ‘Maps of Amsterdam’ at the municipal archive. For this project, citizens were equipped with a so-called GPS tracer, that recorded their routes through the city. By visualizing the data against a black background traces, lines, appeared. From these lines a (partial) map of Amsterdam constructed itself.
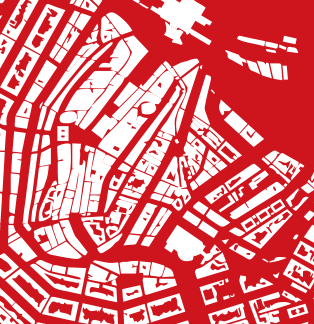
Of more recent date (2013) is the map of all 10 million buildings in The Netherlands, that was developed by Bert Spaan to showcase the possibilities of linked open data within the European CitySDK project. This map production was featured all around the Internet, from The Verge to Wired’s Map Lab. In 2014 we opened a chapter of Maptime in Amsterdam, following the earlier series of meetings on datavisualization titled ‘Big, Open & Beautiful’.
Amsterdam Realtime map
Map of all buildings in the Netherlands